Data & Analytics
Waylaytics
A data-driven platform for comparing U.S. locations.
Tech Stack
React Next.js MongoDB D3.js Python
Key Highlights
- Designed scalable data models for U.S. Census datasets
- Built interactive D3 visualizations for state and city comparisons
- Optimized MongoDB aggregation pipelines for performance
Architecture and Data
- Ingested and normalized U.S. Census and public datasets using Python
- Designed MongoDB schemas optimized for geographic queries
- Built aggregation pipelines to support fast comparisons across states and cities
- Exposed data through a Next.js backend consumed by D3 visualizations
Problem and Solution
Problem
Choosing where to live often requires comparing dozens of disconnected data sources — taxes, housing, crime, education, healthcare, and cost of living — making it difficult to make informed decisions.
Solution
Waylaytics aggregates public datasets into a unified platform, allowing users to compare U.S. locations through interactive visualizations and data-driven insights.
What's next for this project
- Incorporate additional datasets such as climate and employment statistics
- Enhance visualizations with predictive analytics and trend analysis
- Implement user accounts for saving favorite locations and custom comparisons
Screenshots
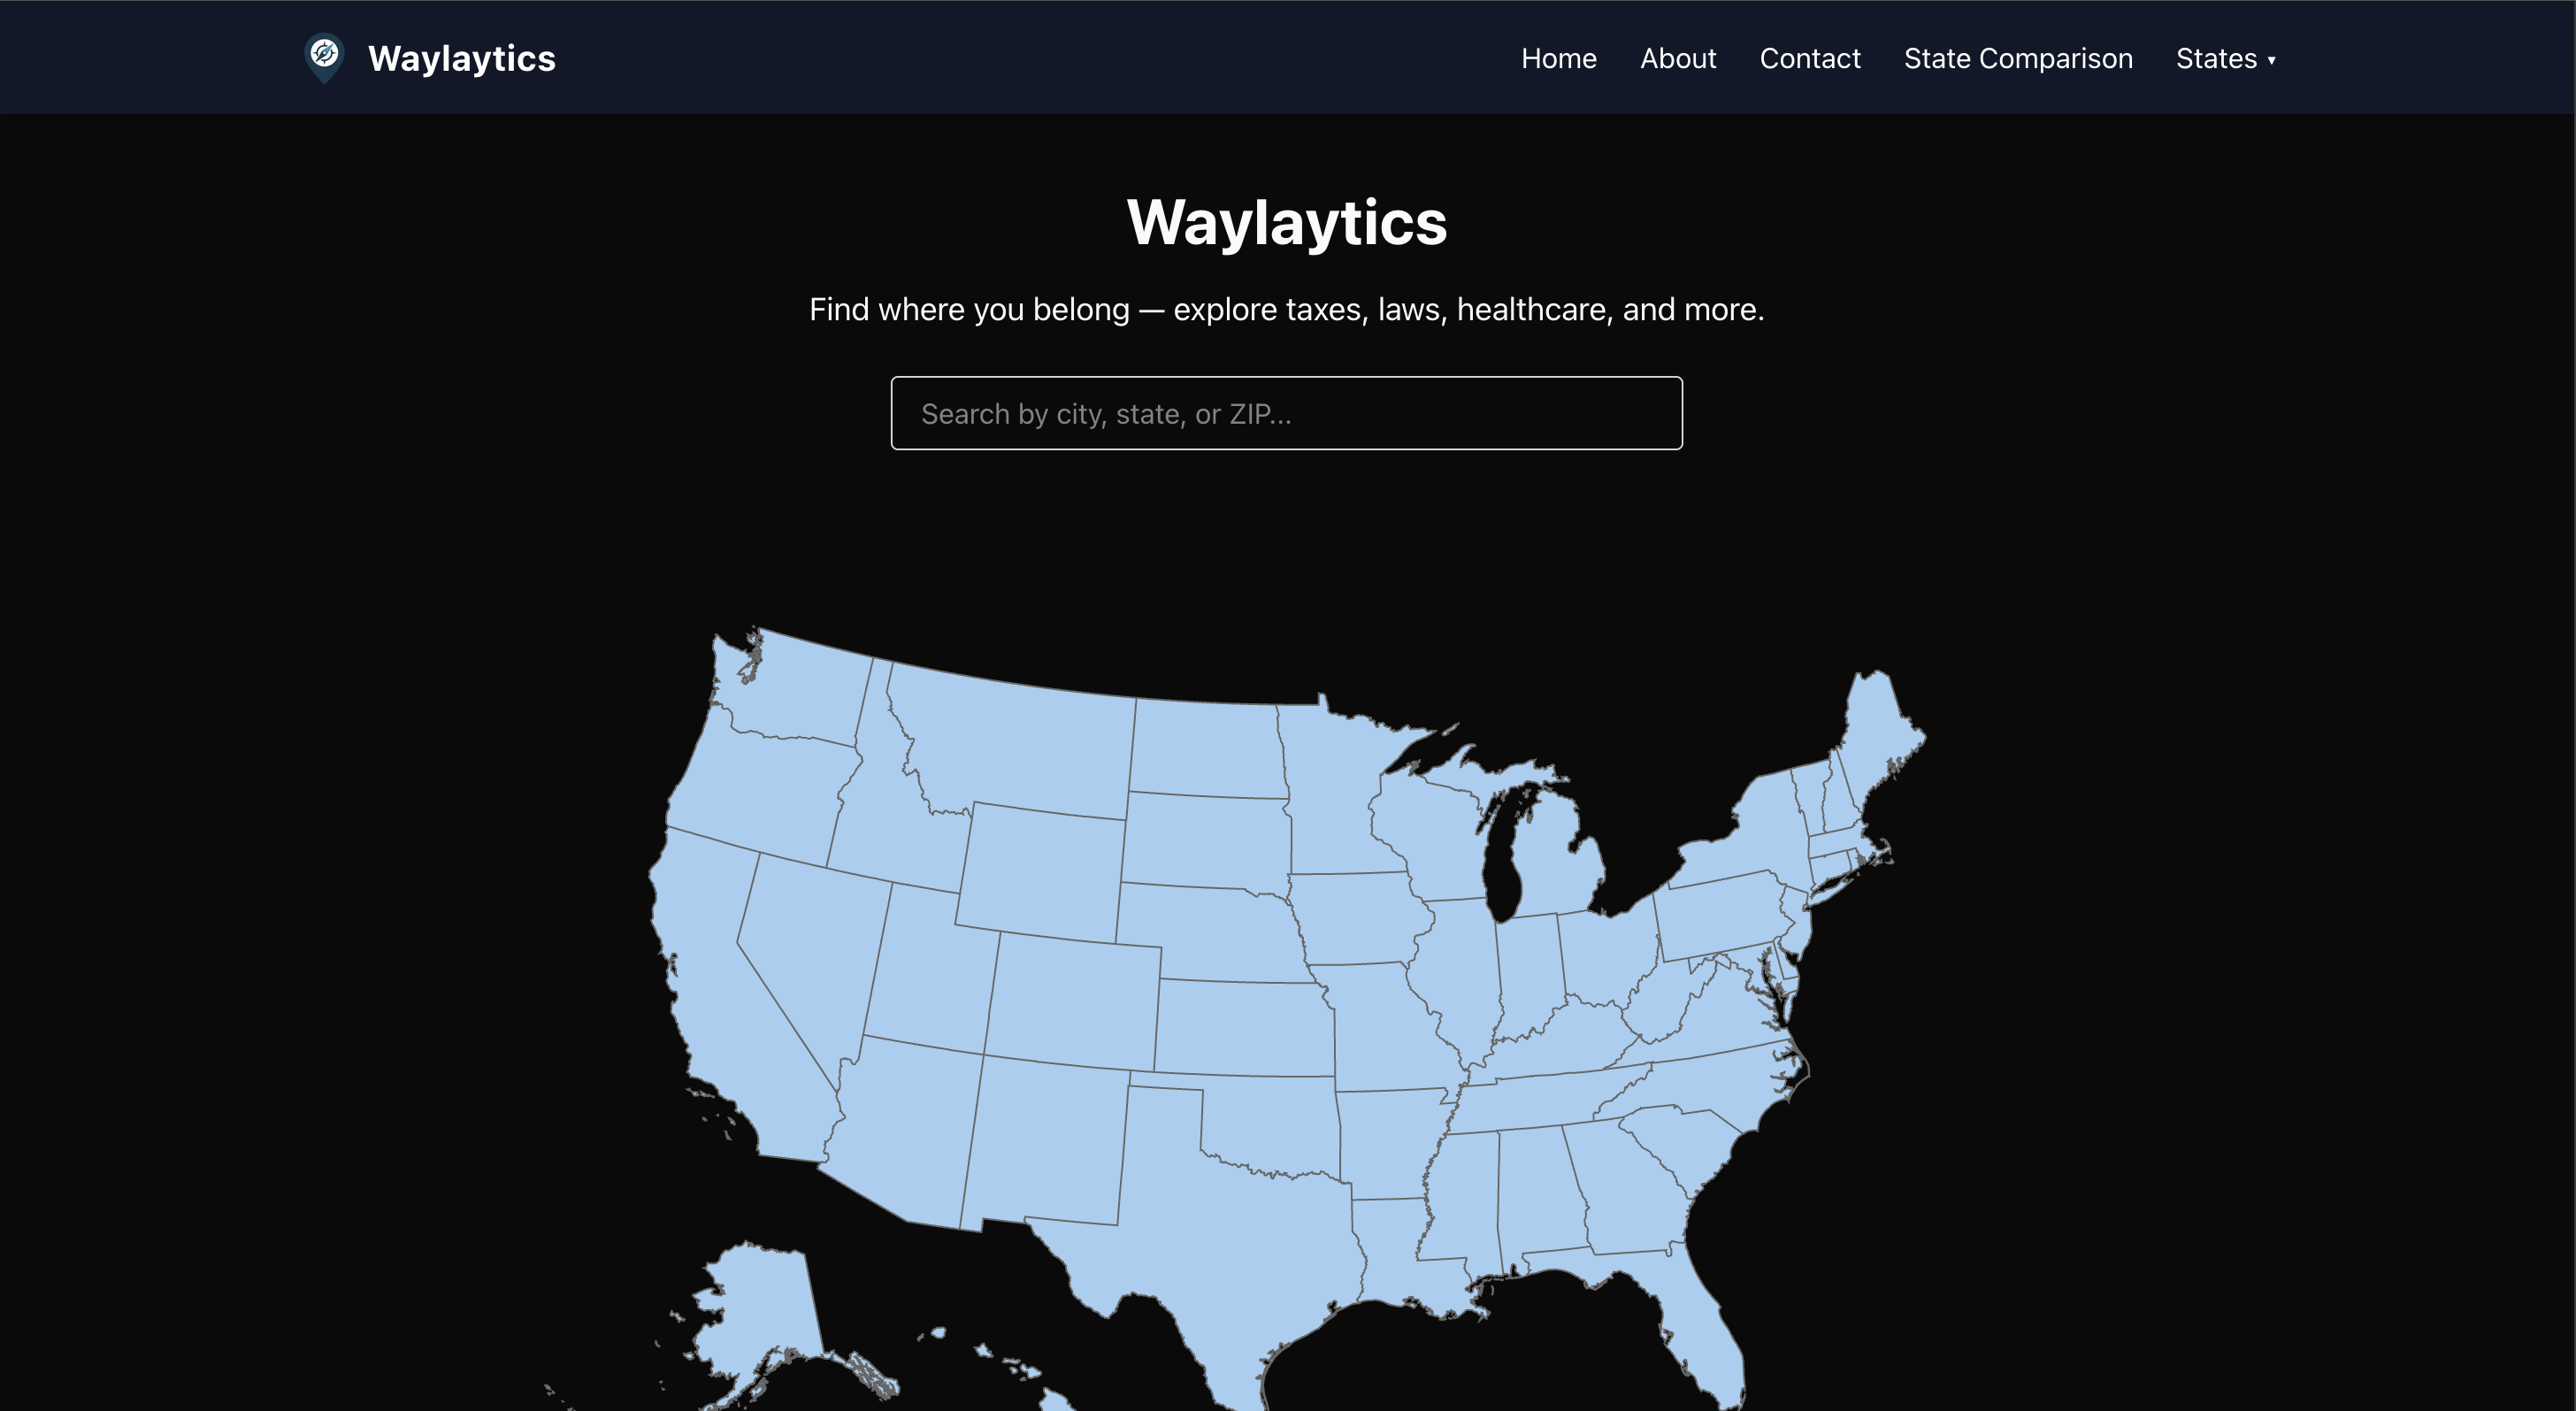 Home Page
 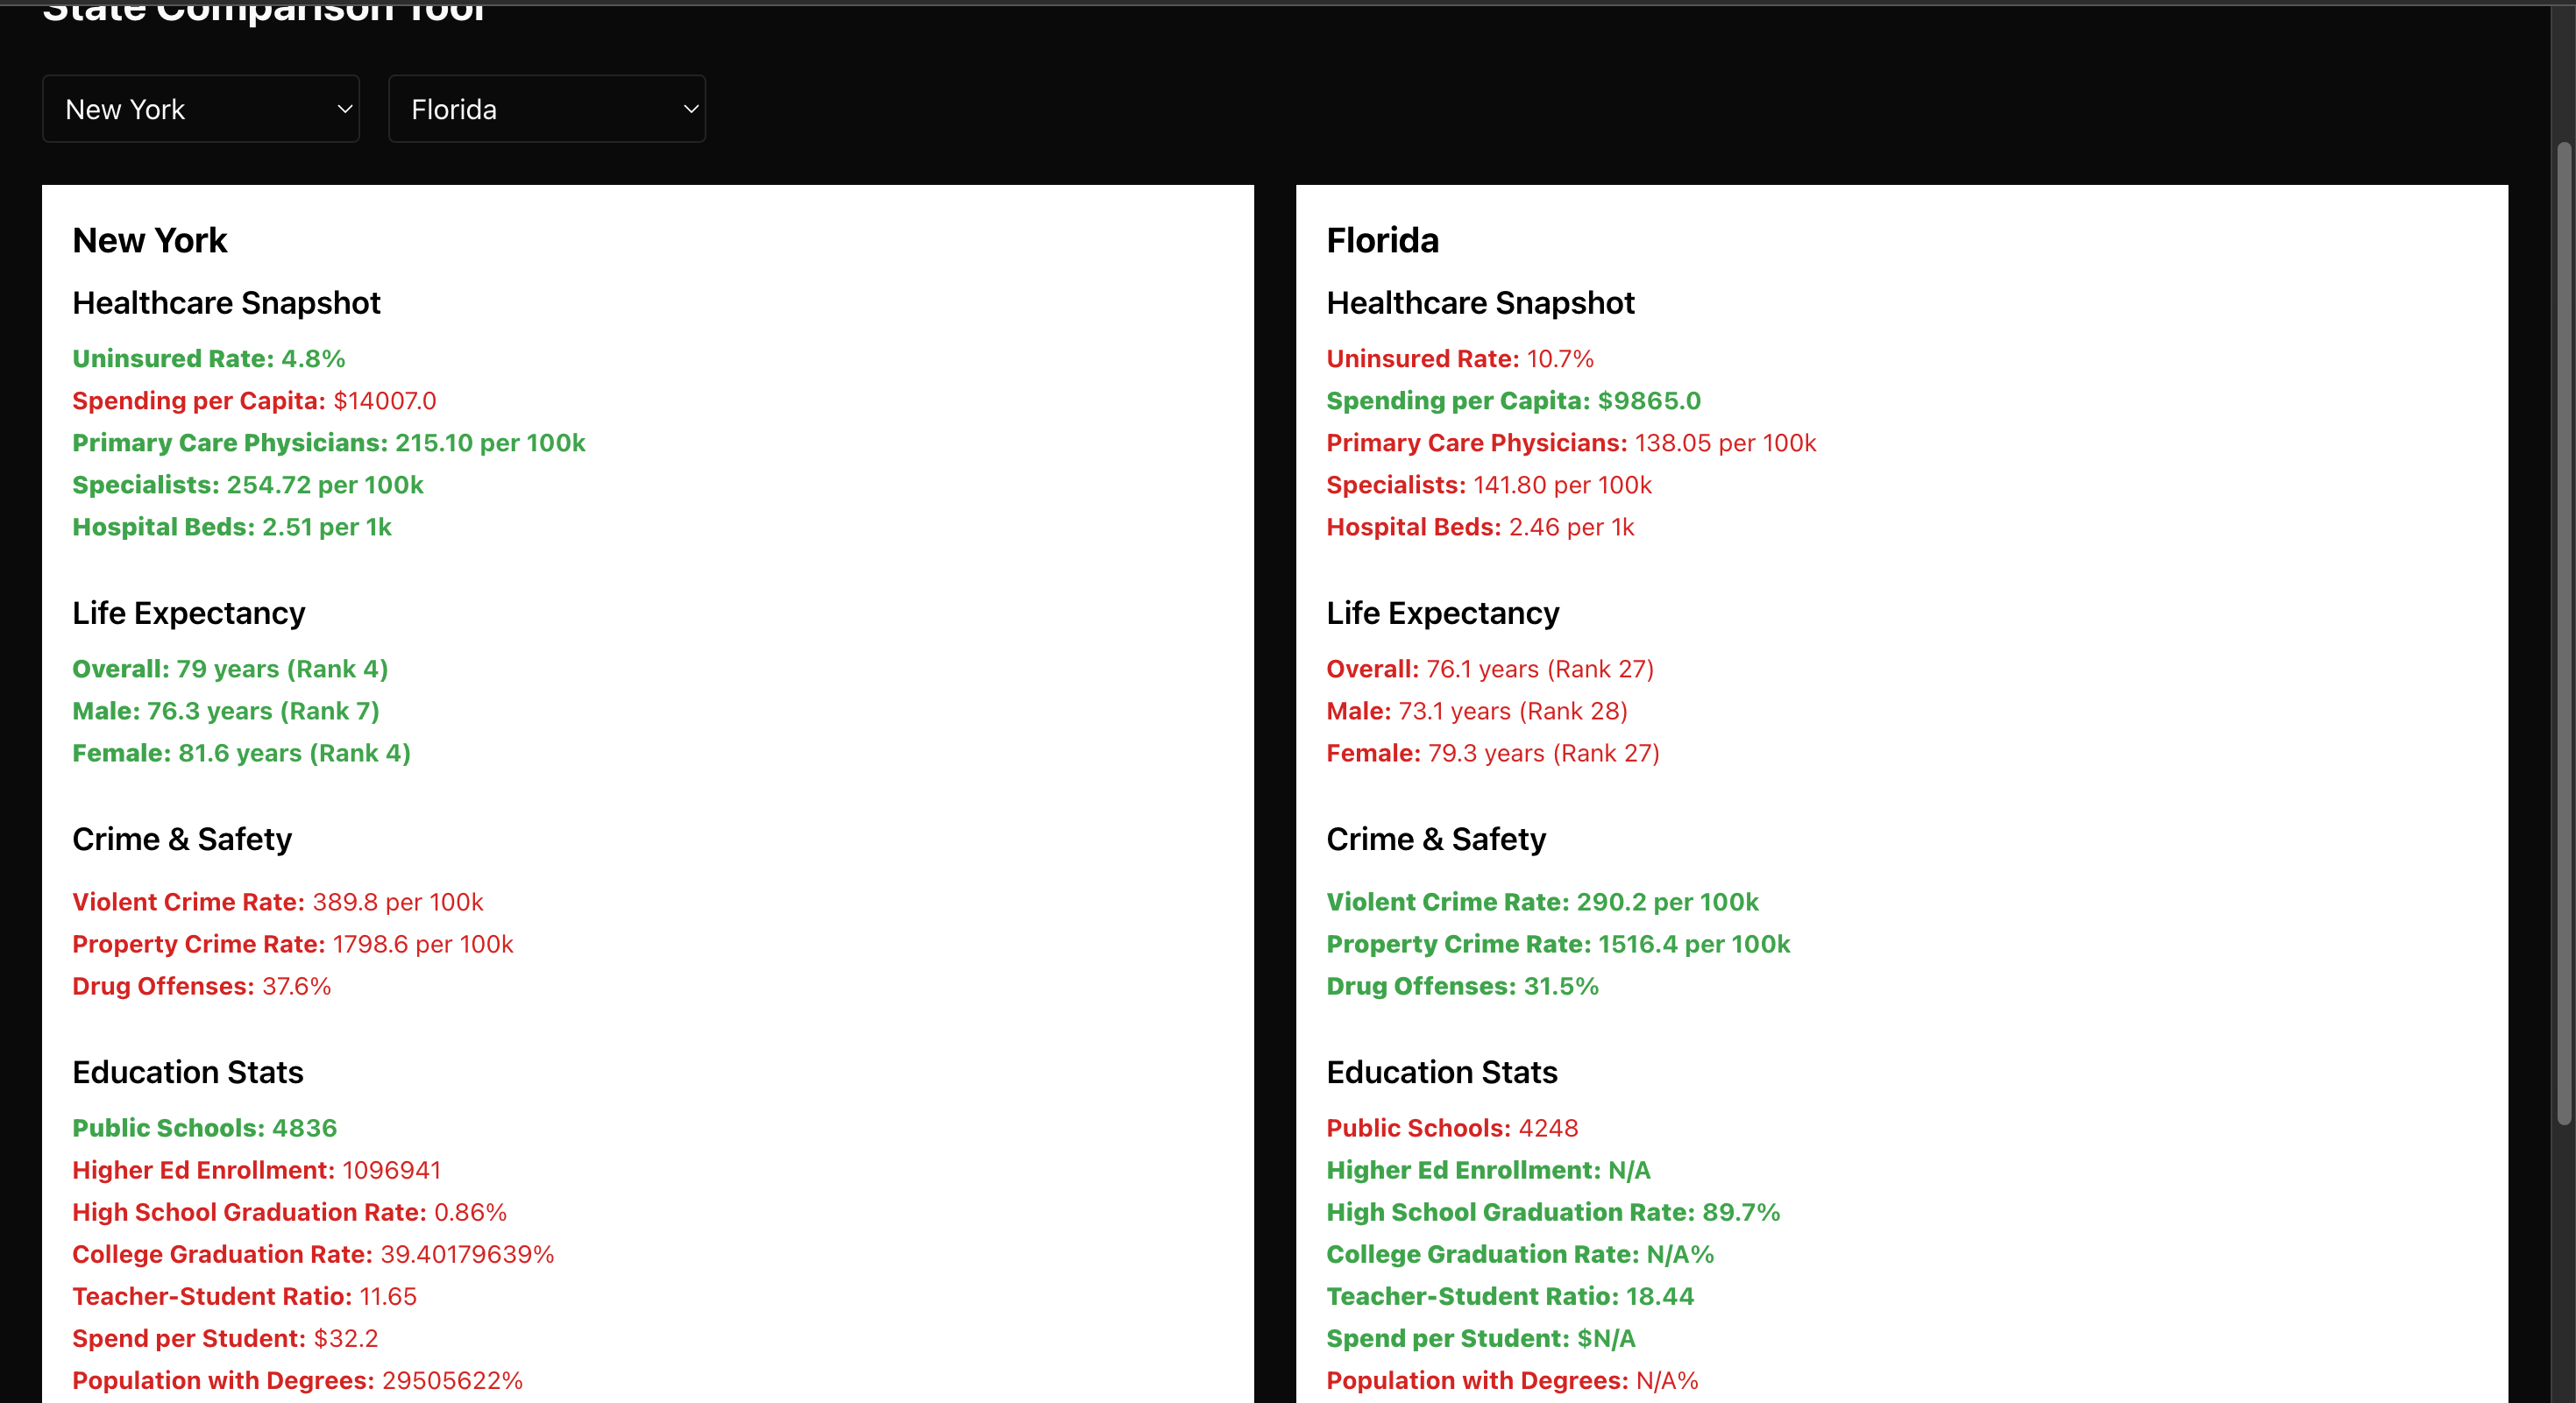 State Comparison View
 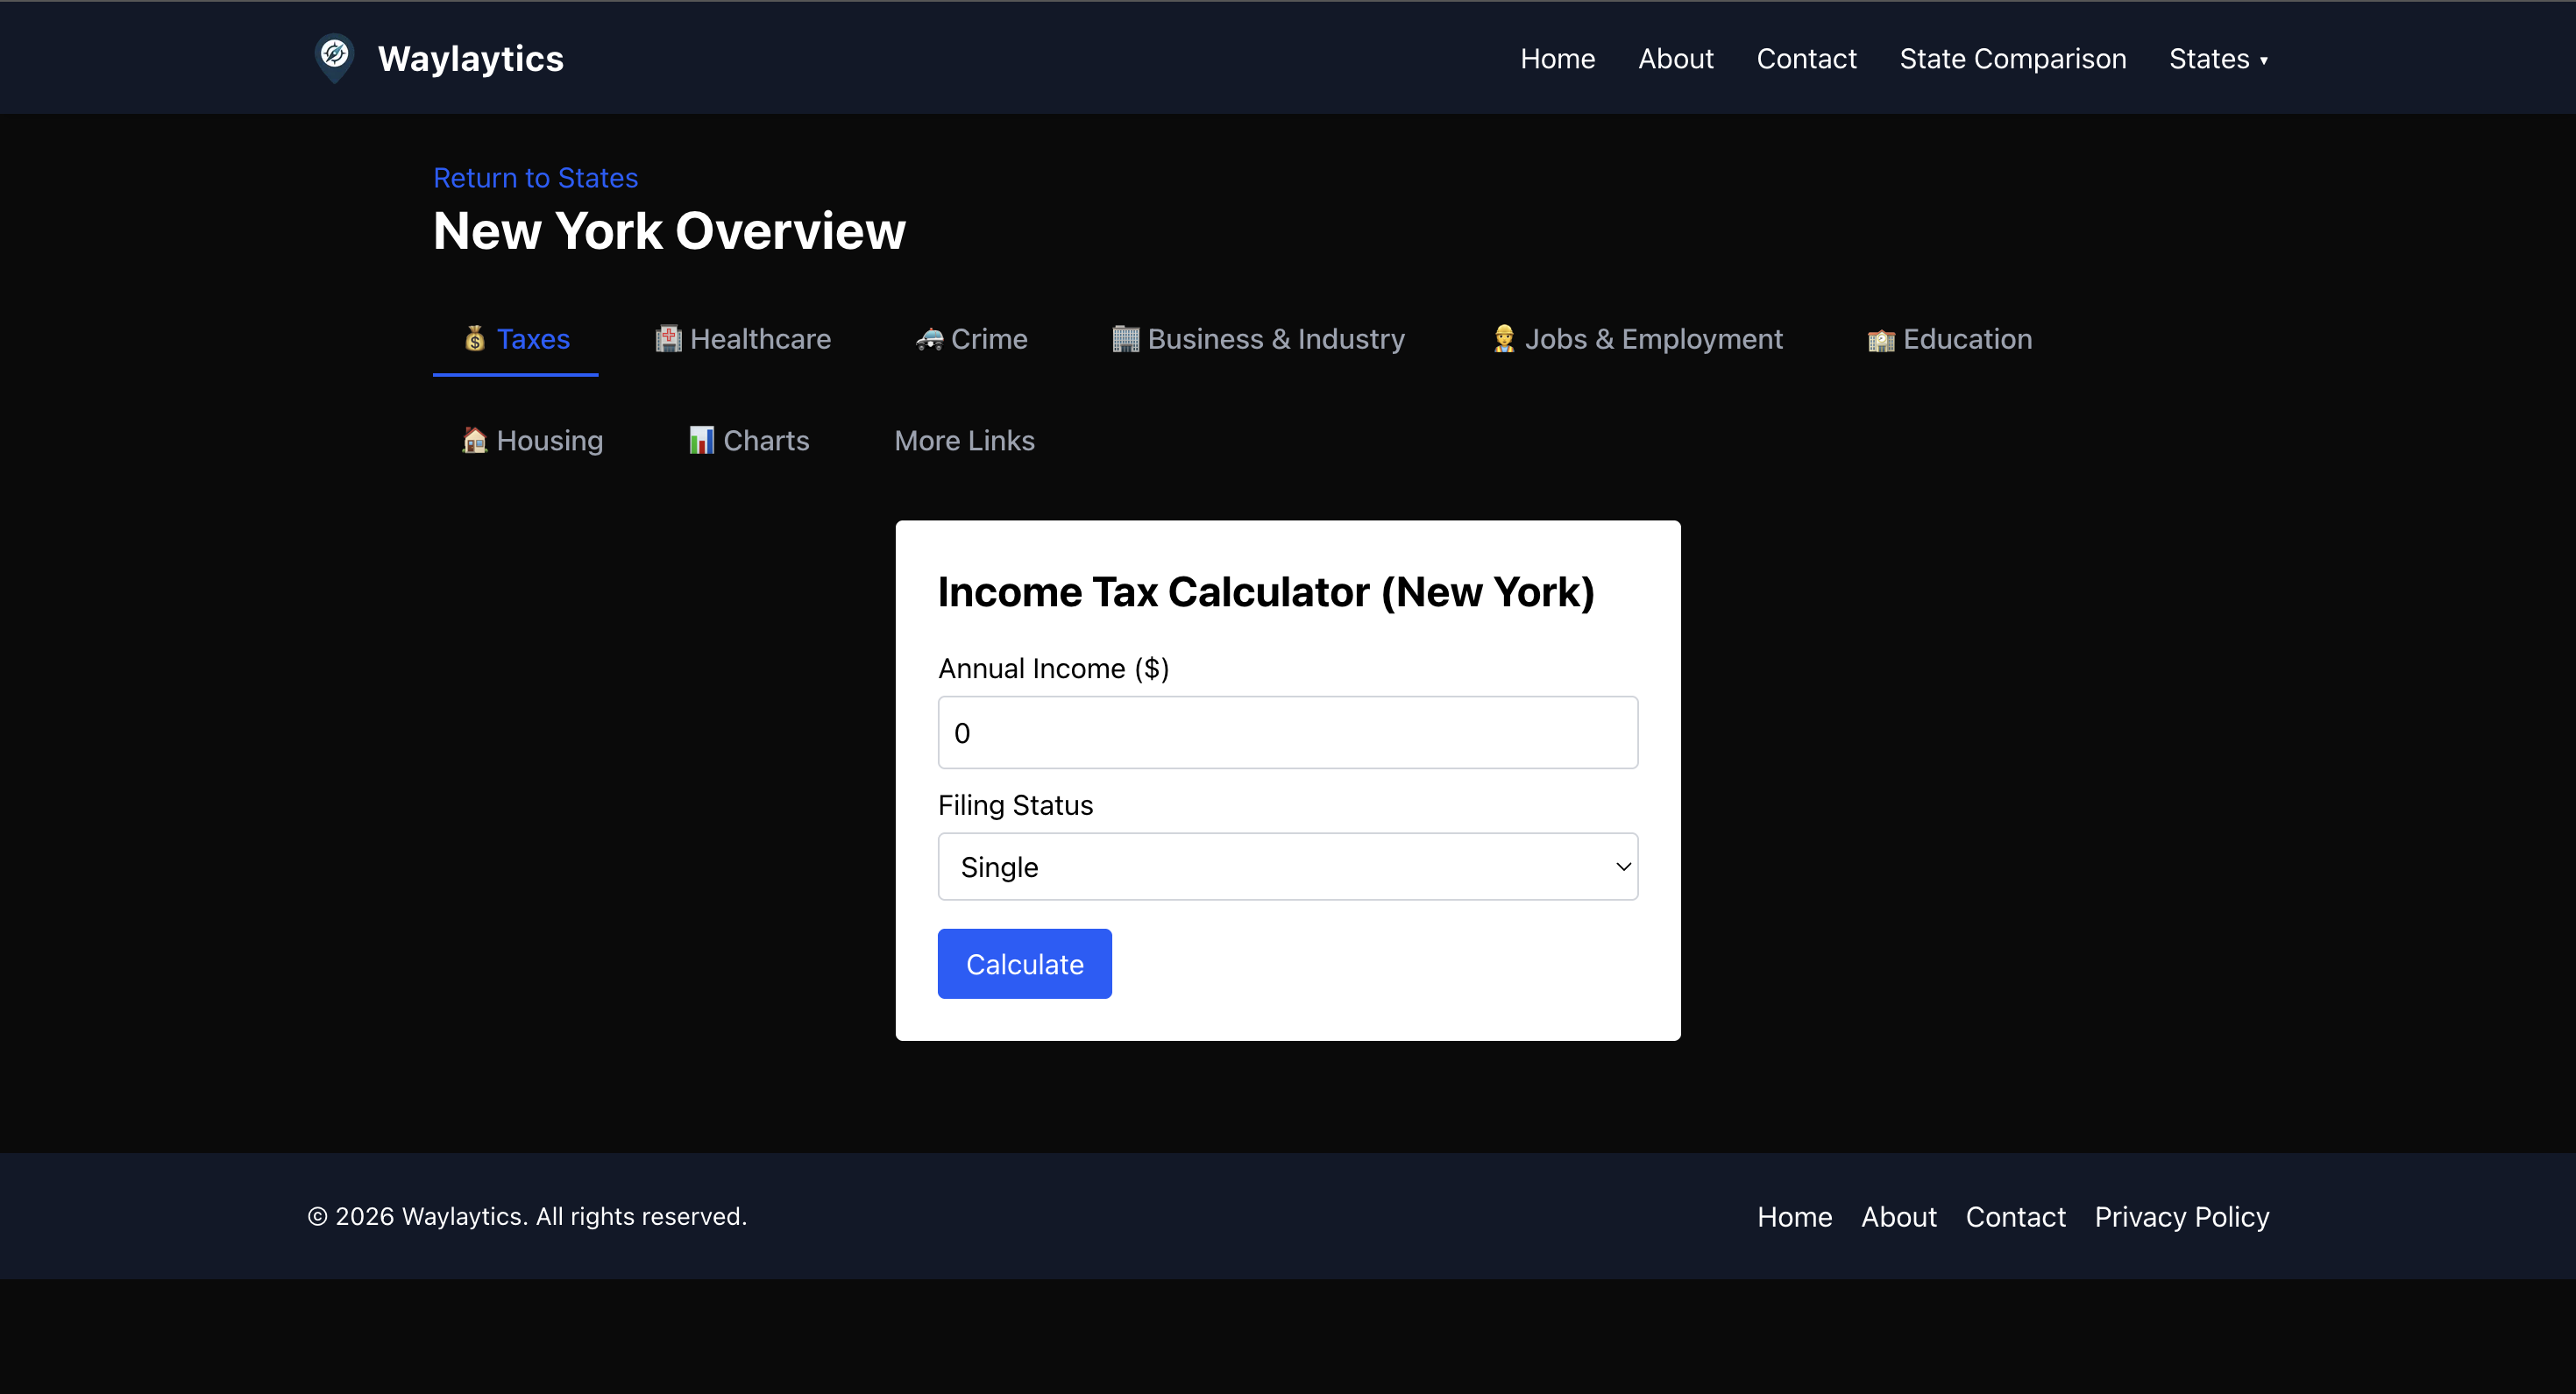 Individual State Page
← Back to projects